Astronomical Opportunities
Summer
2014
Building Blocks - Undergraduate Research and Outreach Projects
Astronomical Opportunities
SPS chapter research project inspired by an encounter at PhysCon 2012
By:Sara-jeanne Vogler, Keeley Townley-Smith, and Cristian Bahrim
Lamar University

In 2012 Sara shared with us a Science News article called “Astronomy Gets Polarized.” Author Ron Cowen described how astronomers can learn the shape of a star after its death by measuring the polarization of the light emitted by the star’s supernova explosion.[1] Curiosity made us wonder whether the shape of any glowing object could be found that way and how a telescope’s optics affect such measurements.
We started with the basic physics of polarized light. According to the one-half law, when nonpolarized or randomly polarized light encounters an ideal polarizer, only 50 percent of the light passes through. The transmitted light has an electric field oriented along the polarizer’s transmission axis. When light that has been thus linearly polarized passes through a second polarizer, the amount that is transmitted depends on the angle between the two linear polarizers. This is malus’ law, or the cosine squared law, mathematically defined as I = Iocos2θ, where Io is the intensity of light going into the polarizer and I is the intensity of the light coming out.[2]
We tested these laws by placing two polarizers in front of a blackbody light source with a polygon-shaped opening and using a highly sensitive light sensor to take readings of the light intensity after it passed through both polarizers. The first polarizer linearly polarized the light emitted from the polygon-shaped opening; the second polarizer had a transmission axis that we could rotate. The ultimate light signal detected by a sensor connected to an interface was processed using software. Our results did not exactly follow the standard laws mentioned above. Sara realized that what was happening was similar to what she had read in the Science News article. The polygon-shaped opening modified the intensity of the light, polarizing it very slightly in selected directions; the longest side of the opening gave the brightest light signal, while the shortest side gave a dimmer light. This was a really interesting result.
Next we measured light that had passed through a circular opening. To no one’s surprise, this time we achieved the even distribution of light intensity in all directions predicted by Malus’ law. We could then calculate the ratio between the polarized signal for a variable-shaped opening and the signal generated by a circularly shaped opening. The deviation of this ratio from the value of 1 can be used to determine the ellipticity of the shape of a light source, such as the core of a supernova.[1]
Up the Ladder to the Roof
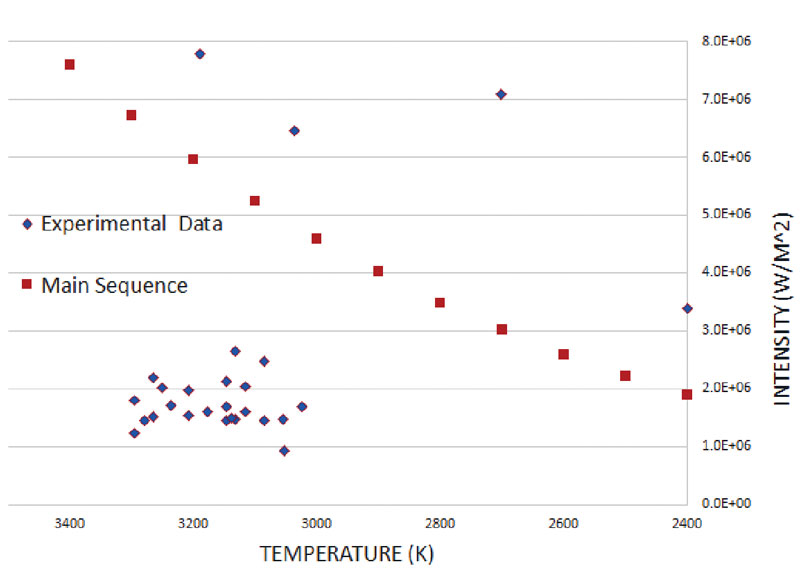
For the second part of our project, we gathered data that we used to recreate the Hertzsprung-Russell diagram, which plots the luminosity of stars versus their surface temperatures. Using this diagram, one can estimate a star’s age and figure out its nuclear and chemical reactivity. By developing a lab-based methodology to recreate the diagram, we were able to really explore the math and science behind it.

In February 2013 we started by collecting data on the color and intensity of various stars from the roof of one of the classroom buildings on campus. Accessing the roof meant climbing up a vertical ladder and through a hatch door. Luckily, we had a firefighter on our team named Jacob, whose knowledge of knots allowed us to haul the telescope, an optics bench, two tripods, a computer, and a bushel of winter clothing through the hatch door.
We had a permanent platform to use for our stellar observations, but the wind and lighting created problems. So did the temperature; even in Texas, it gets pretty cold in February, especially when you are 30 feet off the ground and above the tree line! There were unforeseen issues at night, including a security light pointed straight at us. The complications created by the light as we tried to take readings with our highly sensitive light sensors provided for a hysterical but ultimately productive night. As we overcame the difficulties of designing a new experiment, we learned how to exercise patience and perseverance, and, more importantly, how to have fun with our work.
 For a full year we spent our nights at the telescope and our days in the lab, where we tried to simulate stars with a Bunsen burner. Naively, we expected to be able to simulate a variety of stars, from cooler red giants to hotter dwarfs. But our results ended up modeling only stars located primarily in the main sequence, as our own Sun is. This showed us that flames on Earth, like main sequence stars, are near the thermal equilibrium regime, meaning that the energy released from the interior is balanced by the energy released from the surface. Although the results were not what we expected, they provided new useful knowledge.
Creating a Nebula
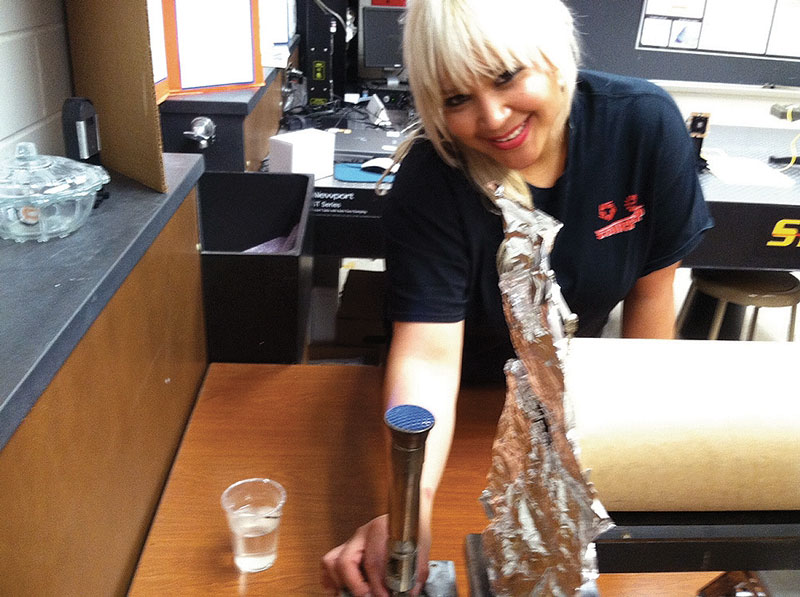
In the last part of our project, we challenged ourselves by studying how to figure out the composition of a faraway nebula based on how it absorbs light passing through it. We decided it would be fun to simulate a nebula in our local indoor atmosphere. Using a blackbody light source, we took the spectra of the source’s radiation after it passed through various gaseous compounds and elements, such as liquid nitrogen, air, sodium, and hydrogen. Imagine trying to line up a light source and detection equipment along a tube that simulates a telescope, and then pouring liquid nitrogen in the tube with the lights off. We finally nailed down a process that could be smoothly executed, gave a good signal, and was easy on the equipment. Our study included the creation of a theoretical curve showing what the Sun’s spectrum should look like when filtered by an unpolluted atmosphere; we generated an absorption spectrum embedded in the blackbody radiation curve using a custom program created with the matrix-based computation and visualization software MATLAB. By comparing our experimental data with this curve, we could identify traces of pollutants in the atmosphere, and, using the relative intensity of their absorption peaks, find the concentration of these pollutants.
Our Local Universe
Nine physics majors at Lamar were involved in the experiments described above. We experienced astronomy research firsthand in ways that would not have been possible at our university otherwise. Classes at Lamar are usually geared toward immediate practical applications, due in part to our strong engineering program. Astronomy is offered at only the freshmen level. Our project provided an inexpensive way for students to use established procedures to perform astronomical measurements in the lab.
Four of our team members presented our atomic spectroscopy research at the Joint Spring 2013 Meeting of the Texas sections of APS, AAPT, and SPS Zone 13 in Stephenville. Then Sara took our project to the Texas Undergraduate Research Day at the Capitol in April 2013, representing Lamar to all the state. In October Sara and Keeley brought our latest results to the Joint Spring 2013 Meeting of the Texas sections of APS, AAPT, and SPS Zone 13 in Brownsville.
Several members of our team were supported by the National Science Foundation’s Students Advancing through Involvement in Research Student Talent Expansion Program (STAIRSTEP) and received funding to disseminate what they learned to students at local high schools and community colleges. It was really fun to talk about our research and create a greater visibility of our physics program at various schools in our area. Most of the students at these schools are from low income families without any college tradition. Hopefully we have inspired them to finish high school and go to college, maybe even to Lamar. //

References
[1] J. Herrmann, “Heterogeneous photocatalysis: Fundamentals and applications to th1. Cowen, Ron. Astronomy Gets Polarized. Science News. July 8, 2006, Vol. 170, 2, pp. 24–25.
[2] Hecht, Eugene. Optics. 4th edition, Addison Wesley, ISBN 0–8053–8566–5.
About the Award
SPS chapters are eligible for up to $2,000 in funding for research projects through the SPS Chapter Research Award (formerly called the Sigma Pi Sigma Undergraduate Research Award). Applications are due November 15. For details see www.spsnational.org/awards/chapter-research.
More from this department
Building Blocks - Undergraduate Research and Outreach Projects
